02 / Land and evidence
Find the right place to grow
A grassland pixel is an observation about vegetation. A viable farm also requires legal access, suitable soil and water, infrastructure, ecological safeguards and local consent.
- 01Locate a candidate
- 02Verify rights and suitability
- 03Agree a workable site
01
What the existing satellite work tells us
The country records combine a dated land-cover baseline with separate, more recent vegetation screening. ESA WorldCover v200 describes 2021 land cover. Sentinel observations retain their own dates and limitations.
Land-cover calculations now use documented country boundaries for all 15 records. Regional screening can help direct a land search, but parcel selection still requires recent detailed observations, local classification checks and a site visit. Each country record explains what its calculation supports.
02
What has not been established
No regional inventory of legally available parcels has been demonstrated. Grassland may be grazed, ecologically valuable, contested, or unsuitable for cultivation. Former plantations also need parcel-level evidence; their history cannot be inferred from land cover alone.
The Barbados land and rental leads require current written confirmation, mapped boundaries, tenure review, water assessment and site inspection before acreage can enter a pilot budget.
03
How a candidate becomes a pilot site
Start with an owner-verified parcel boundary. Check present use and any users’ rights, protected habitats, slope and access. Inspect soils, drainage, water quantity and quality, utilities, storm exposure and roads. Obtain current terms and planning advice.
Use recent, cloud-screened satellite imagery to guide the inspection and establish a dated baseline. Keep excluded areas, uncertainty and evidence gaps visible. Report gross parcel area and net plantable area separately.
From the satellite record
See the land.
Read the signal.
Explore the same landscape in natural colour and through its vegetation signal.
Sentinel-2 · January–September 2026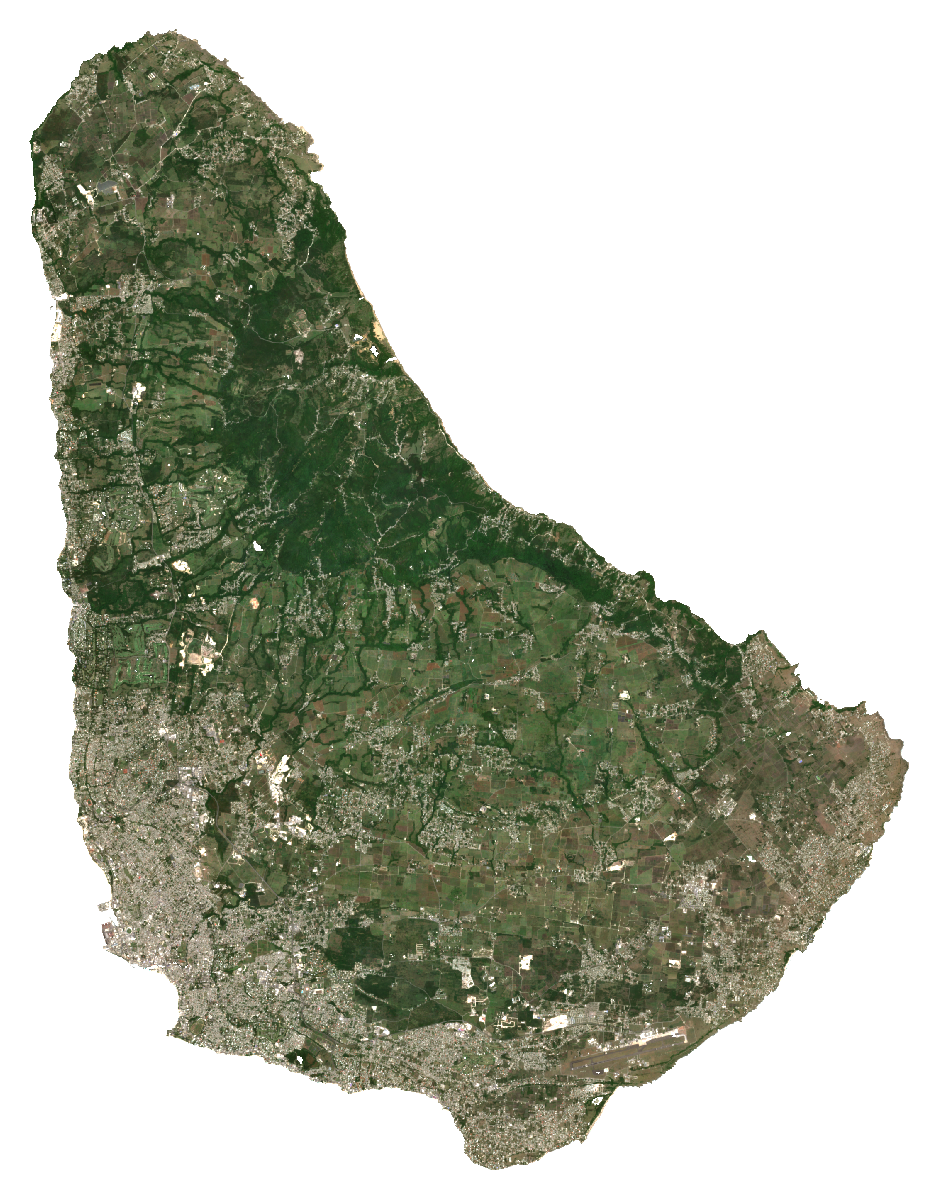
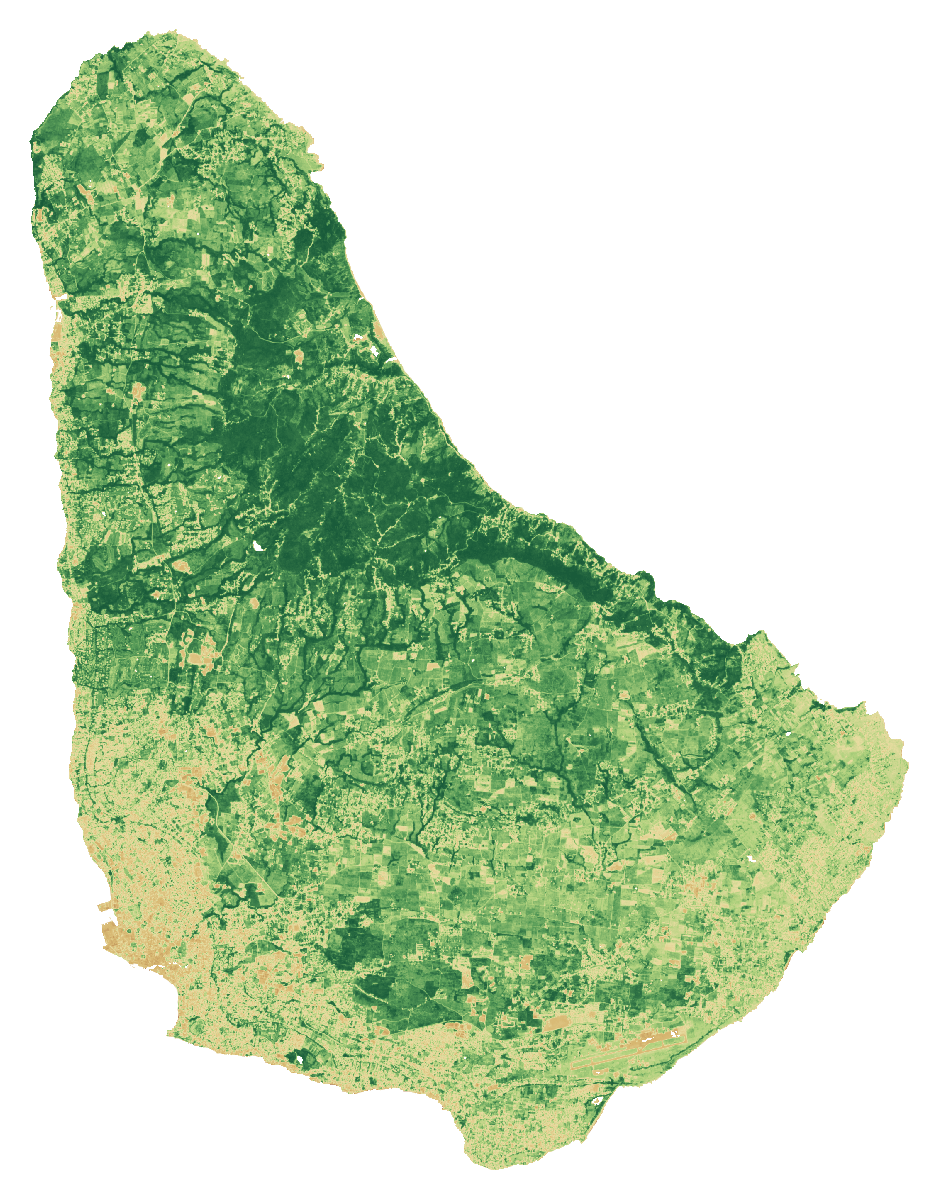 RGB · Natural colourBarbadosCloud-screened median composites
Stronger vegetation signals can include forests, pasture and crops. The dark background shows masked water, areas outside the study boundary or missing data.
A monitoring example · Barbados
Greenness changes through the months.
Each point is the spatial mean of that month’s median NDVI over observed grid cells. Different months can have different clear views.
NDVI axis: 0 to 1. Seasonal conditions, cloud screening and changes in observed cells can influence this line. It is not a measure of harvests, crop health or available land.
Monthly values and observation coverage
| 2026 month | Mean NDVI | Observed cells | Grid-cell coverage | Source granules |
|---|---|---|---|---|
| Jan | 0.621 | 412 / 416 | 99.0% | 10 |
| Feb | 0.590 | 413 / 416 | 99.3% | 11 |
| Mar | 0.539 | 410 / 416 | 98.6% | 9 |
| Apr | 0.462 | 397 / 416 | 95.4% | 7 |
| May | 0.412 | 415 / 416 | 99.8% | 14 |
| Jun | 0.344 | 342 / 416 | 82.2% | 11 |
| Jul | 0.537 | 408 / 416 | 98.1% | 13 |
| Aug | 0.529 | 416 / 416 | 100.0% | 12 |
| Sept | 0.597 | 416 / 416 | 100.0% | 12 |
Coverage refers to cells on this fixed grid, not national area coverage or classification accuracy. Monthly medians cannot be averaged to reproduce the full-period median. The monthly grid is pinned separately from the archived screening calculation.
Download the monthly values and method ↓How to read these images and inspect the sources
Natural colour combines the red, green and blue bands (B4, B3, B2). NDVI compares near-infrared and red reflectance: (B8 − B4) / (B8 + B4). Both views use the same dated scene list and extent, with cloud and shadow screening. Each pixel summarises observations across the period; this is not a single photograph.
The colour scale is fixed across countries; values beyond its endpoints use the endpoint colours. The separate NDVI statistic is the spatial mean of the temporal-median index on the documented 1 km screening grid. Image pixels use the display grid stated above.
These views help guide a closer inspection. They do not identify available rental land, confirm ownership or measure agricultural suitability.
- A temporal median of observations in January–September 2026, not a single-date photograph.
- RGB and NDVI use identical bounds, display grid and valid-pixel masks. Higher NDVI indicates greater spectral greenness, not crop identity, yield, land vacancy or suitability.
- Transparent pixels represent the selected boundary/land mask or missing valid observations, not proof of absent vegetation.
- The overview grid is for display. The published numerical screening uses a separate 1 km grid; do not extract hectares or availability from these coloured pixels.
- Cloud and shadow masking can leave residual haze or remove valid surfaces. Native 10 m source bands do not make the overview a 10 m product.
Download the imagery reproduction package ↓
Contains modified Copernicus Sentinel data (2026), processed for CaribVista.